Damle
SAYLI
Autonomous Vehicle
Cyber Security Interface
Starting from the "Blank Slate" to creating interactive front end interface

The Concept
The days of manual car driving are getting narrower.
Today, vehicles are more software-driven than mechanical, software security has a direct impact on safety. The technologies broaden the feature set of vehicles and improve user experience but the incontrovertible downside is that the automotive attack surface is constantly expanding, and vehicles are vulnerable to attacks on such systems.
Vehicles today are connected and equipped with advanced safety features and systems. These automated systems must make decisions, based on available data. This data is vulnerable to tampering and spoofing. These inputs must be secured from outside attacks, unapproved access, tampering, and generally protected from anything that may have an impact on vehicle safety and security.
The Project
As a cyber security for software provider in autonomous vehicles, my customer came to me with bunch of requirements. With domain knowledge to share and collaborate, my role was to implement Desktop Application Interface for security operation centers and ensure the goal of protection for software, devices, and data throughout the connected vehicle ecosystem is addressed with user centric application interface.
High Level goals :
-
Research, conceptualize, design and develop client side front end security application for security operation center.
-
Research and Design , car dashboard for alerts and secure responses for demos.
My Role
As an entrepreneur
Lead project from scratch till frontend UI delivery, also a solo designer for project — worked hands on discovery, user research, conceptualization, prototype, Visual design, animation, Led front end development and testing
Cross Collaboration
While leading the project have cross collaborated with Data scientists, subject matter experts, security center engineers and stakeholders.
CASE STUDY
Dashboard , Smart Mobility, Operations View
Solving a Wicked Problem
Research, Exploration and Analysis
Security operation center - Client facing application
Along with subject matter experts and data scientists from client side, I started the process of discovery of this new age technology with lot of knowledge exchange and competitor analysis. I was briefed about how ECU protection, communication protection monitoring, device management customization and integration is done as a product to safeguard softwares hardware and data that runs on autonomous vehicles. We started studying case studies of few global service providers of such services in the industry.
Recognizing and understanding tasks
Runtime monitoring is a versatile technique for detecting property violations in safety-critical systems.
My first task was to understand and monitor the run time data of incidences logged and monitor alerts of various fleet types and systems , discover how logged threats work, how are solutions are implimented and provide a visual solution to my customer in coordination with cloud based trusted mobility platform.
The Challenges
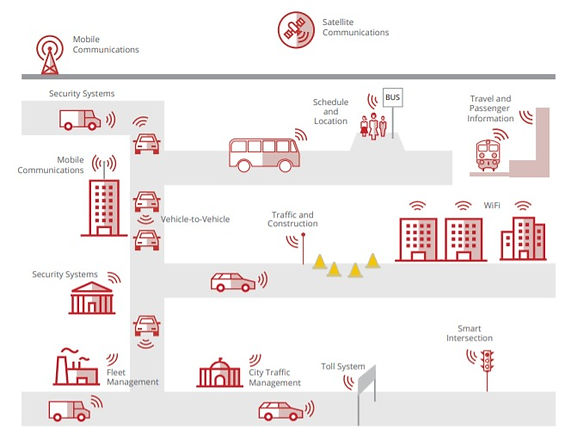
Mobility ecosystem
As we started researching on domain knowledge the fist step was to understand how autonomous ecosystem work and how they work around vehicle systems functionality. Learn how associated sensors, hardware units and softwares role in it.
Incidence trigger journey
A journey of logged live incidence is simplified with a mind map created after a brief from a domain expert. Making complex explanations a bit easier for designers.


Sample study
This study provided insight to the industry competitors and some take aways on treands and best practices in this domain.
Threat Attributes
Best possible and usable User experience matters when research is done with in depth study of micro tasks. Going deep into what a treat log attributes look like to ideate the data to design journey.

This is pretty much it
Design Journey

target user
The target users for autonomous vehicles security solution application are engineers in support operation center for autonomous vehicle service providers.

" Our technical soldiers on support front needs efficient application interface for 360 degree support in research and prevent cyber attacks. "
Joy of shaping your product
Sketches and Wireframes
Giving a face to the large data display in most useful way
Three questions informed my design strategy :
-
How do you design complex data for single screen, innovatively ?
-
What user goals needs to be addressed within minimum interactions?
-
What’s the perfect overview of analytics?
Here is how interactions and the structure started getting shaped after multiple discussions and revisions on paper.


Early sketches and wireframes of dashboard analytical graphs and lists
The Goal
We had a mission to drive the space " Safety in our hands ".
It is not just a place to display all analytics, fleet alert and incidence data, but to understand the cyber-risk posed by cyber criminals suggest the application should be considered as the sum of its hardware and software based sub-components. Moreover, the interface shall propose a comprehensive cyber security assessment and must discover, understand, and address any vulnerabilities within each component and address task in most effective manner. Design smart to accommodate holistic interface to enable support center users facilitating functionality with quick action and a resolve in minimal possible time to safeguard mishapps is essential to safeguard millions of autonomous vehicles and customers.
The Solution
An established approach to consolidate the variety of different perspectives is the breakdown of UX into pragmatic attributes. With an increasing technological maturity we did put more emphasis on pragmatic product attributes in order to ensure the quality of everyday actions - particularly when designing assistive technologies. Considering new age design processes and vision in hands, we labeled each design task with one line motto transforming complex data into insightful, easy to scan, and actionable metrics for each user across organization for security operation center.
Dashboard - Role based display global overview, with access to the gist of the important data, functions and best possible consolidated controls. Single screen where information can be monitored over a glance.
Operations view - Showcase large number of attributes and cross data information of different types of fleet and logged incidence data which shall be self intuitive and easy to take action on within a single screen for the users ( support center executives ) to quickly understand and act upon. Providing collapse and graphical status and micro animated interactions wherever required to keep it less boring. Receive real-time data updates through web sockets and display.
Fleet summary - Showcase real-time maps, POI search results, and precise geolocations, control fleet movements, maintain a full overview of fleet resources and the status of individual vehicles, monitor vehicles’ technical parameters, increase fleet efficiency and optimize navigation with real-time route and point-of-interest information.
Project in its final stages
Visual Interface Design


Dashboard
The target users of this application are autonomous vehicle service providers for example Uber, Amazon, Apple, Audi, BMW. These companies user base is in millions. Dashboard is the landing space for the support team, providing analysis and data summaries within the limited space.
Such as :
-
Attack status statistics
-
Fleet attack attributes with periodic lists
-
A location map with different metric types
-
Graphs to showcase analytical data in periodic comparision
-
Global search option
-
Profile and other generic details
2
3
4
5
6
Dashboard Components

2
Attack status Bar :
In order to analyze the live fleet attack statistics, a short summary serves the purpose of its interactions with differently perceived workloads in live pool. Such as
-
Total number of vehicles
-
Active vehicles
-
Attacked vehicles
-
Protected Vehicles
-
Anomalies detected
Map chart view
3
Periodic data display :
Fleet and attack data is largely analysed on past and current logs. The comparison plays a crucial part in detecting similarities in location, type and method Etc. The position of these tabs is within global navigation space to serve to multiple verticles of data.
4
Fleet Attack list :
There is a detailed attack list and attributes along with appropriate action functions in drill down mode. A quick list is displayed on dashboard to skim through the latest logged attacks for the user.
5
Map chart display type :
In various stages of attack resolve or prevention, users required to map the fleet attack within different type of parameters. Example,
For Exact Location - Map view
For Density of attacks - Heat chart
For Multiple set of values - Bubble chart
6
Data analytics :
Analytics across various data types is displayed in the form of line graphs. Providing periodic, comparative colour coded results.
1
Vertical Navigation :
There are multiple reasons to choose vertical navigation in an application
-
The medium for the platform is desktop
-
Each section has more number of sub sections which needs a horizontal space to serve multiple sections. It also gives an advantage of scalability in future..
1
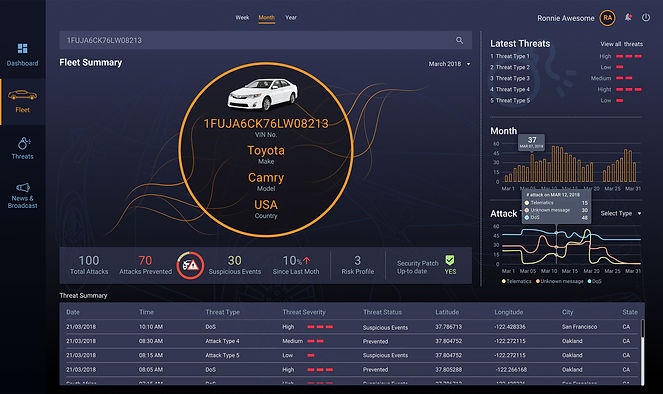
Fleet Summary
Individual fleet threat summary tab updates a new threat logged in every 5 seconds with individual vehicles short summary details.


1
Threat Summary detail list :
One of the key goal is to provide threat attributes with maximum possible details in one row to analyse the required action on the attack. Complex Information architecture and structuring the list with a combination of tabular and graphical forms sets a good challenge.
1


Design Customization for a different
service provider as per UI requirements

Threat Posture - assigning Logged Incident
Drill down incidence report and assign log task function
The space where operation center associate can view detailed, physical system damages, its status and past assigned service requests.
More Projects partnered for this domain
Logo and Branding
corporate Website
marketing/ promotional material
event display and prototype support
corporate branding video
saylidamlepatil@gmail.com Mobile: +91 9359951881